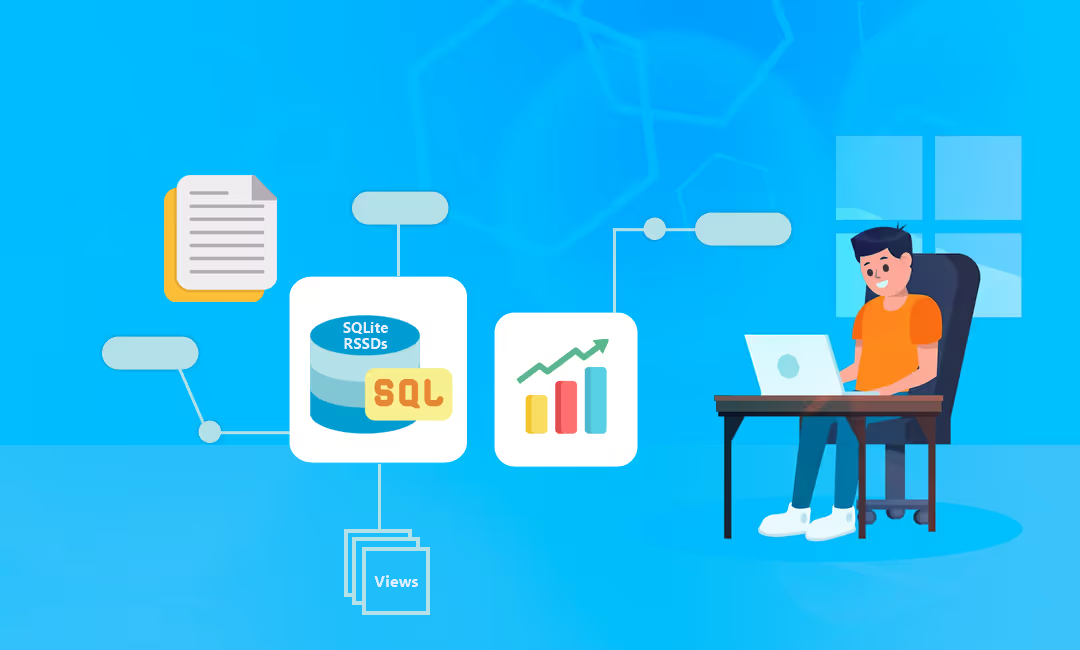
If you’re an SQL engineer trying to learn the ropes of data engineering, you might have heard the term ELT and wondered how it differs from ETL. Both are processes for integrating data from multiple sources, but ELT stands for Extract, Load, Transform, while ETL is Extract, Transform, Load. In this blog post, we will explore how to leverage SQLite and SQL views for a lightweight ELT process that integrates disparate tables into a unified view.
Our specific use case will involve aggregating patient remote monitoring data from various devices into a single unified view for Continuous Glucose Monitoring (CGM) tracings. We’ll break down each step in a way that’s approachable and practical, giving you the tools to work with real data while keeping the infrastructure lightweight.
Background on ELT and Why We Use It
The classic ETL strategy involves transforming data before loading it into your storage system, which typically requires more complex workflows, external tools, and a lot of up-front work. In contrast, ELT lets you extract the data as-is, load it into your database, and then transform it in place, often with SQL views, which makes it great for exploratory work or environments with less infrastructure.
SQLite is a great fit here because it’s lightweight, widely supported, and doesn’t require complex setup—perfect for small to medium datasets or rapid prototyping.
Setting the Scene: Ingesting the Data
Imagine we have data from multiple devices—perhaps CGMs, smartwatches, and other monitoring devices—that all capture remote patient monitoring data. After ingesting these data sources, we end up with tables like table_1, table_2, table_3, and table_4 in our SQLite database. Each table represents a different device and has different columns, even though they all describe patient data for similar remote monitoring purposes.
For example:
- table_1 has columns like
patient_id,device_id,timestamp,glucose_level - table_2 has columns like
id,time_recorded,patient_number,cgm_value - table_3 has columns like
pat_id,recorded_at,glucose_reading,sensor - table_4 has columns like
identifier,time_taken,patient_ref,sugar_level
The Challenge: Creating a Unified View
We need to create a single unified view called patient_rpm_mode_cgm that gives us all CGM tracings in a common format. Since ELT focuses on transforming data in place, we will write SQL to transform and union the data from these disparate tables. Our ultimate goal is to create a view that presents common column names—let’s standardize them to:
patient_idtimestampglucose_leveldevice_type(a new column that does not exist in the physical tables)source(a new column to indicate the origin table)
Step 1: Understanding the Source Tables
The first step in transforming this data is to understand how each source table maps to our target columns. To standardize the columns:
| Source Table | Source Columns | Target Columns |
|---|---|---|
| table_1 | patient_id, timestamp, glucose_level | patient_id, timestamp, glucose_level, ‘CGM’ AS device_type, ‘table_1’ AS source |
| table_2 | patient_number, time_recorded, cgm_value | patient_id, timestamp, glucose_level, ‘CGM’ AS device_type, ‘table_2’ AS source |
| table_3 | pat_id, recorded_at, glucose_reading | patient_id, timestamp, glucose_level, ‘CGM’ AS device_type, ‘table_3’ AS source |
| table_4 | patient_ref, time_taken, sugar_level | patient_id, timestamp, glucose_level, ‘CGM’ AS device_type, ‘table_4’ AS source |
Step 2: Writing the Transformation Queries
We need to write queries that extract the relevant fields from each table, aliasing the columns to standardize their names, and adding new columns as needed.
For example, to transform table_2:
SELECT patient_number AS patient_id, time_recorded AS timestamp, cgm_value AS glucose_level, 'CGM' AS device_type, 'table_2' AS sourceFROM table_2;Similarly, for table_3:
SELECT pat_id AS patient_id, recorded_at AS timestamp, glucose_reading AS glucose_level, 'CGM' AS device_type, 'table_3' AS sourceFROM table_3;Step 3: Combining the Queries with UNION
Next, we need to combine these transformed queries using UNION ALL. Using UNION ALL is appropriate here because it ensures we retain all records, even if they have duplicate values (which may be necessary for auditing or detailed analysis).
Here’s the complete SQL to create our view:
CREATE VIEW patient_rpm_mode_cgm ASSELECT    patient_id,    timestamp,    glucose_level,    'CGM' AS device_type,    'table_1' AS sourceFROM    table_1
UNION ALL
SELECT    patient_number AS patient_id,    time_recorded AS timestamp,    cgm_value AS glucose_level,    'CGM' AS device_type,    'table_2' AS sourceFROM    table_2
UNION ALL
SELECT    pat_id AS patient_id,    recorded_at AS timestamp,    glucose_reading AS glucose_level,    'CGM' AS device_type,    'table_3' AS sourceFROM    table_3
UNION ALL
SELECT    patient_ref AS patient_id,    time_taken AS timestamp,    sugar_level AS glucose_level,    'CGM' AS device_type,    'table_4' AS sourceFROM    table_4
UNION ALL
SELECT    'unknown' AS patient_id,    '1970-01-01 00:00:00' AS timestamp,    0 AS glucose_level,    'CGM' AS device_type,    'synthetic' AS source;
Step 4: Adding More Transformations with Views
One of the key benefits of ELT using views is the ability to easily add more transformations without altering the raw data or writing complex ETL pipelines. Here are some additional common transformations that are better handled through views:
1. Standardizing Data Formats
In many cases, different tables may store data in different formats. For example, timestamps might be stored in different formats or time zones. Using a view, you can standardize these formats:
CREATE VIEW standardized_patient_rpm_mode_cgm ASSELECT patient_id, DATETIME(timestamp) AS standardized_timestamp, glucose_level, device_type, sourceFROM patient_rpm_mode_cgm;This view ensures that all timestamps are in the same format, making downstream analysis much easier.
2. Filtering and Cleaning Data
You may want to exclude certain rows from analysis, such as rows with missing or invalid data. Views are a great way to create a “clean” dataset:
CREATE VIEW clean_patient_rpm_mode_cgm ASSELECT patient_id, timestamp, glucose_level, device_type, sourceFROM patient_rpm_mode_cgmWHERE glucose_level > 0;This view filters out any rows where glucose_level is 0 or negative, which may represent invalid data.
3. Aggregating Data
You can also use views to create aggregate data that can be used for reporting or analysis. For example, creating a view that provides daily average glucose levels for each patient:
CREATE VIEW daily_avg_glucose ASSELECT patient_id, DATE(timestamp) AS day, AVG(glucose_level) AS avg_glucose_levelFROM patient_rpm_mode_cgmGROUP BY patient_id, day;This aggregated view makes it easy to analyze trends over time without needing to write aggregation queries repeatedly.
4. Creating Derived Metrics
If you need to create new metrics based on existing columns, views are a great way to handle this. For example, you might want to create a derived metric called glucose_category to categorize glucose levels:
CREATE VIEW patient_glucose_category ASSELECT patient_id, timestamp, glucose_level, CASE WHEN glucose_level < 70 THEN 'Low' WHEN glucose_level BETWEEN 70 AND 140 THEN 'Normal' WHEN glucose_level > 140 THEN 'High' ELSE 'Unknown' END AS glucose_category, device_type, sourceFROM patient_rpm_mode_cgm;This view adds a new column that categorizes glucose levels into ‘Low’, ‘Normal’, or ‘High’.
Step 5: Validating the Unified View
After creating the view, it’s always good practice to validate the results. You can use a SELECT query to make sure everything looks right:
SELECT * FROM patient_rpm_mode_cgm LIMIT 10;Review the data to ensure that the column names are standardized and that the values align as expected. Pay particular attention to the timestamp column to ensure formats are consistent.
Step 6: Leveraging the View for Downstream Analysis
With the patient_rpm_mode_cgm view in place, downstream processes can now treat this data as a consistent and unified source. Analysts can run queries like:
SELECT patient_id, AVG(glucose_level) AS avg_glucose_levelFROM patient_rpm_mode_cgmGROUP BY patient_id;This allows for seamless analysis without needing to worry about device-specific table structures.
Why ELT with SQLite?
You might wonder why ELT is a good fit for this scenario. Here are some reasons:
- Flexibility: ELT allows you to load data as-is and apply transformations later when you have a better understanding of the data.
- Simplicity: SQLite is simple to set up, and using views means that transformations are written declaratively with SQL, which is easy for teams to understand and modify.
- Lightweight: No heavyweight ETL tools are required, which makes this approach perfect for small datasets or prototyping.
Conclusion
By using SQLite and SQL views, we’ve demonstrated a lightweight and modern approach to ETL (or, more precisely, ELT) that helps simplify the process of integrating data from multiple sources. This approach allows for greater flexibility, and by leveraging SQL views, we can keep the transformation logic declarative and transparent.
Whether you’re prototyping a new data pipeline, working with smaller datasets, or need a low-maintenance integration solution, this ELT strategy with SQLite is an excellent option. We hope this guide helps you get started on your journey towards modern data engineering!
Next Steps
To deepen your understanding, try adding more transformations or aggregations to the patient_rpm_mode_cgm view. You could, for example, normalize the timestamp formats or add additional metadata to the view to help with analysis. Feel free to experiment and explore how SQLite’s capabilities can further simplify your data engineering workflow.

